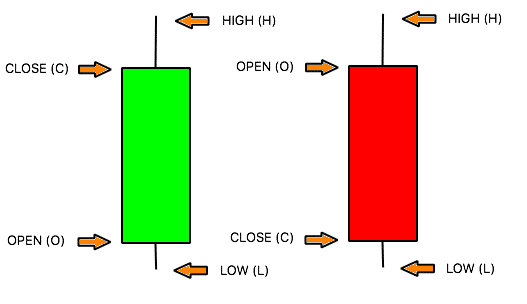
The candlestick OHLC bars is a type of 2D chart used to illustrate movements in the price of a financial assets over time. Each vertical line on the chart shows the price range over one unit of time. Usually it is a useful tool to analyze the prices of the markets so that the traders invest in a timely manner their assets.
A brief explication about the meaning OHLC bars is the follow:
- OPEN: First offer of the day
- HIGH: Highest price of the day
- LOW: Lowest price of the day
- CLOSE: Last offer of the day
Experienced users before make a trade, perform an analysis of the curves formed by a set of these bars over a period of time, this evaluation allows users to decide the investment time. When the beginning of a bullish pattern is found, it is the best investment moment.